Groceries Are Squeezing Voters Harder Than Housing Heading Into the Midterms
Oobit
5
min read
Table of contents
Grocery prices were 2.2% higher in August than a year earlier, according to the U.S. Bureau of Labor Statistics. That's below the overall inflation rate of 3.4%. Even so, groceries still beat out rent and mortgage payments as the bill voters said strained them most.
Ahead of the November 3rd midterms, Oobit surveyed 1,005 registered U.S. voters. We asked which costs had squeezed them since 2024, what they'd given up to cover the gap, and how their household budgets could decide their vote. The results show where the pressure is heaviest, who's feeling it, and what it would take for a candidate to win over voters who are watching every dollar.
Key Takeaways
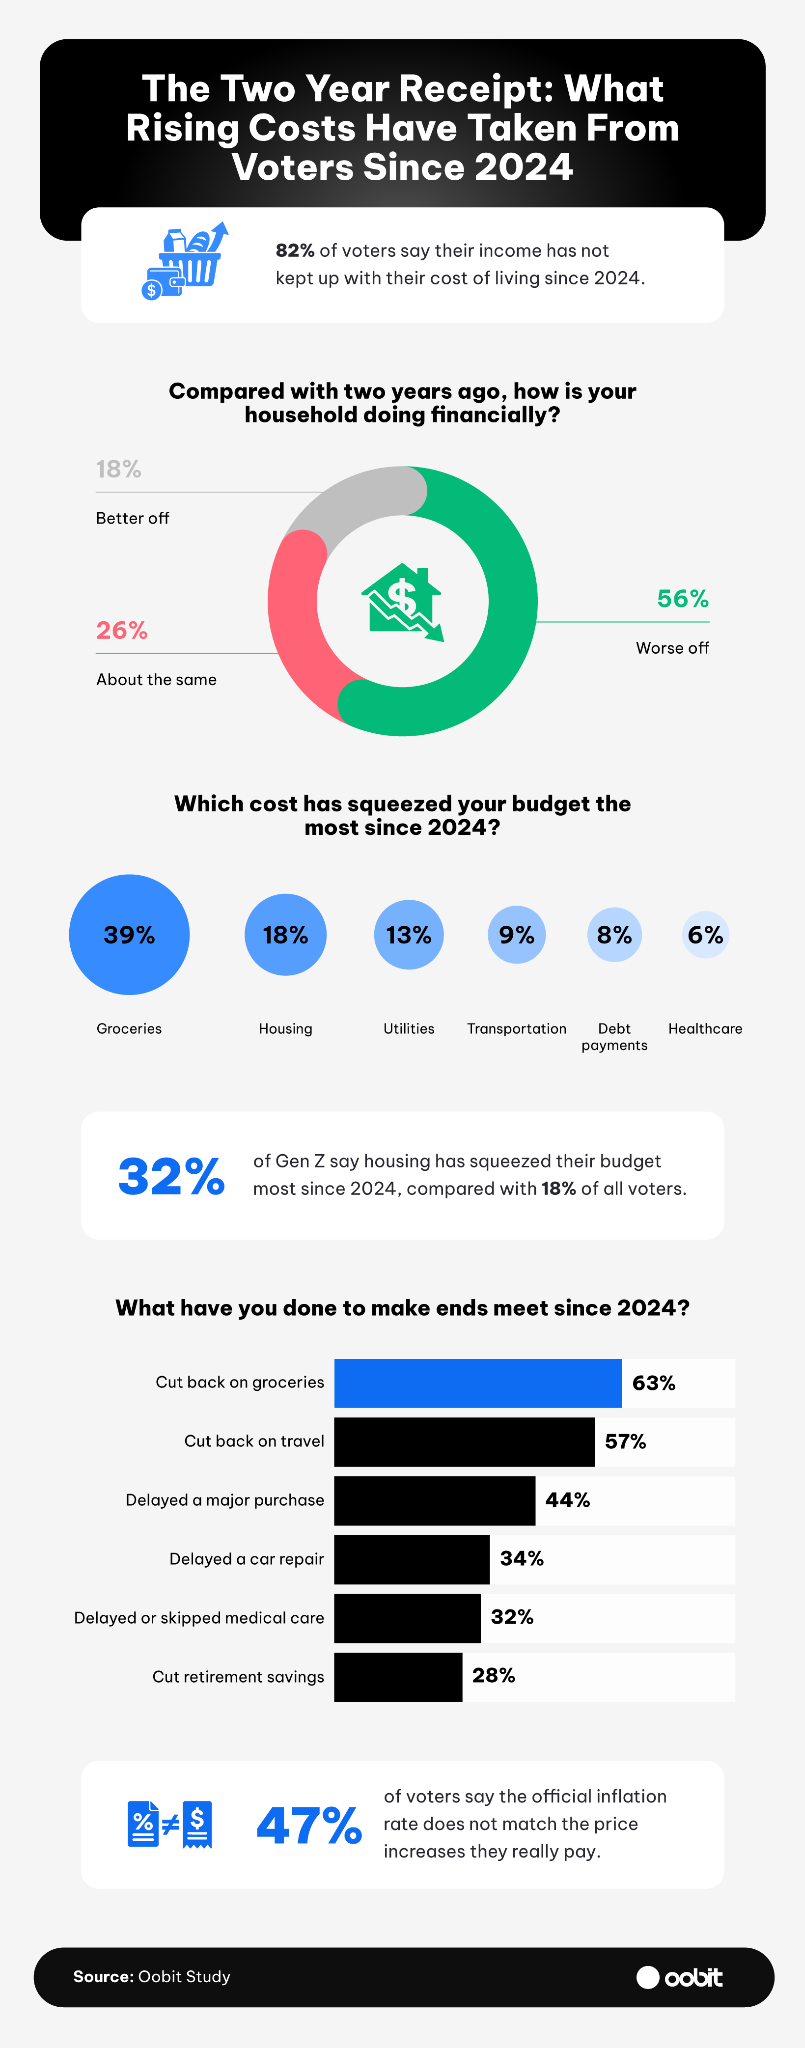
More than 4 in 5 voters (82%) say their income hasn't kept up with their cost of living since 2024.
Groceries are the cost squeezing voters hardest (39%), ahead of housing (18%), utilities (13%), and healthcare (6%).
Nearly 1 in 3 voters (32%) have delayed or skipped medical care to make ends meet since 2024.
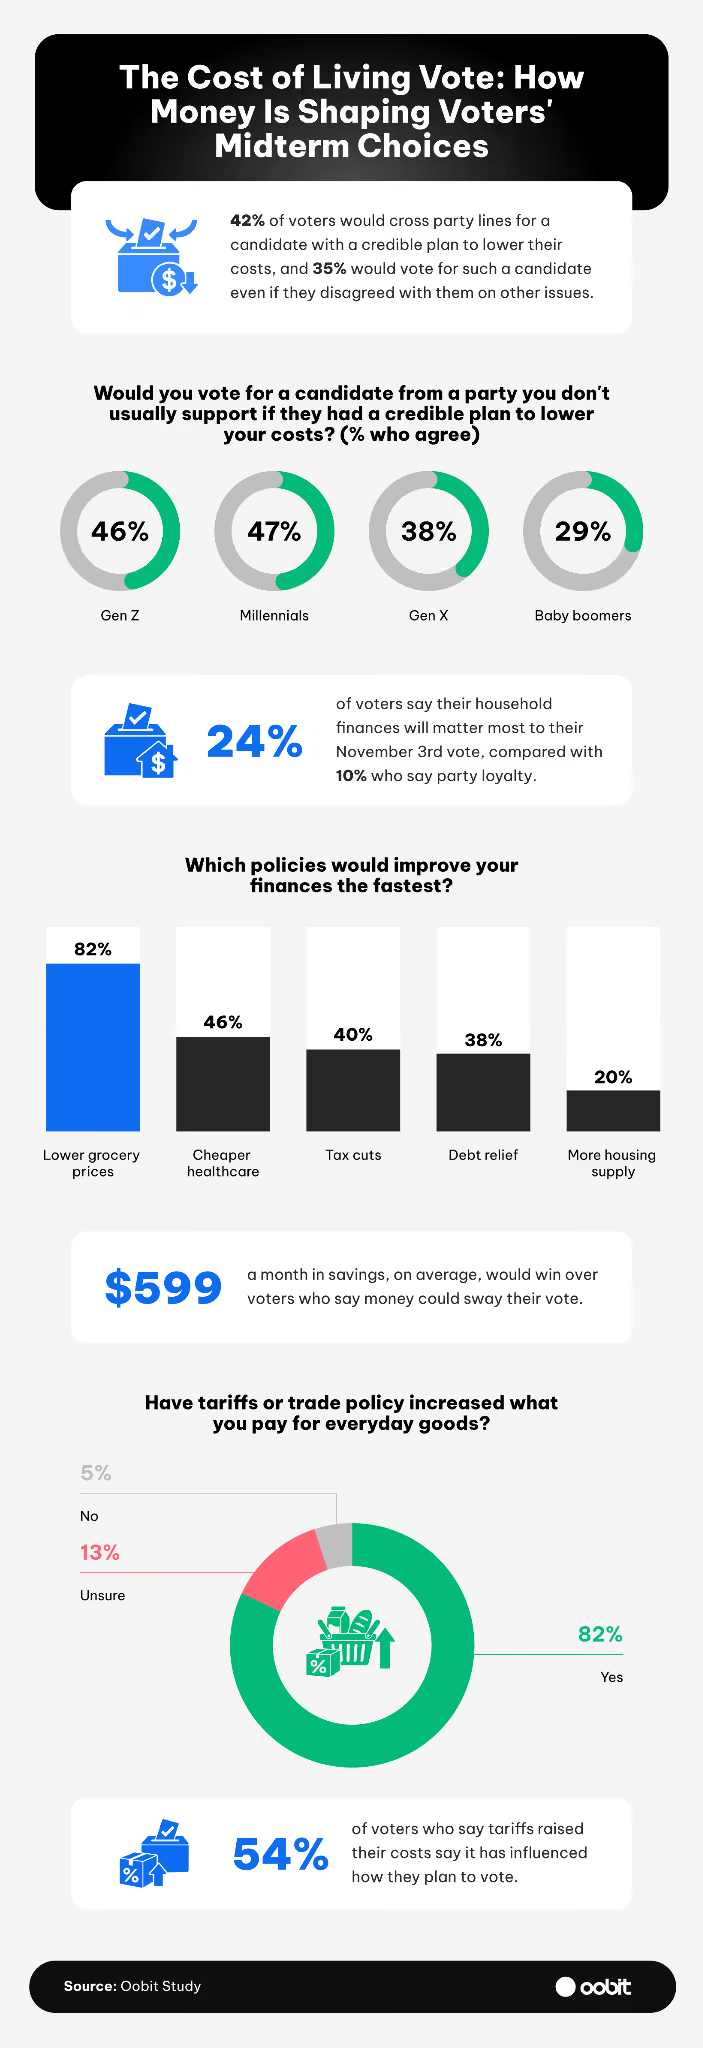
Cost savings could win over 42% of voters, who'd need an average of $599 a month.
42% of voters would cross party lines for a candidate with a credible plan to lower costs, rising to 47% among millennials and 46% among Gen Z.
Household finances outrank party loyalty as the top factor in voters' November 3rd decision (24% vs. 10%).
The Costs Squeezing Voters Hardest Since 2024
Paychecks fell behind for most voters, and the gap was widest in the Northeast:
More than 4 in 5 voters (82%) say their income hasn't kept up with their cost of living since 2024, including 75% of Gen Z, 83% of millennials, 84% of Gen X, and 84% of baby boomers.
Northeast voters feel it most, with 87% saying their paychecks haven't kept pace, the highest share of any region.
Groceries top the list of costs that squeezed voters hardest (39%), more than double housing (18%). Utilities (13%) and healthcare (6%) follow.
29% of Gen Z, 41% of millennials, 41% of Gen X, and 45% of baby boomers say groceries squeeze their budget most.
Nearly 1 in 3 voters (32%) had delayed or skipped medical care to make ends meet, including 36% of women and 26% of men.
Cost savings could earn the vote of 42% of voters, who say they'd need an average of $599 a month.
What Voters Want From Candidates on AI
Voters leaned toward guardrails when asked which approach to artificial intelligence they most wanted candidates to prioritize:
Nearly half (46%) want AI regulated for safety and privacy reasons.
About 1 in 4 (26%) want candidates to focus on protecting jobs from AI.
Fewer voters (14%) want candidates to use AI to lower costs and improve productivity.
Only 4% favor limited regulation to encourage innovation, and 9% say AI isn't a priority for them.
How Household Budgets Could Swing the Midterm Vote
For many voters, money outranked party loyalty heading into the elections:
Nearly 1 in 4 voters (24%) say household finances would matter most to their vote, while fewer (10%) say party loyalty would.
About a third (32%) agree their household budget has changed how they plan to vote.
More than 2 in 5 voters (42%) say they'd cross party lines for a candidate with a credible plan to lower costs, rising to 47% of millennials and 46% of Gen Z.
Who Would Vote on a Cost-of-Living Plan Alone
Independents are the most willing to back a candidate on a cost-of-living plan alone, even if they disagree with them on other issues. Nearly half of independents (45%) say they'd do so, compared with 36% of Republicans and 30% of Democrats.
Younger voters were more open to it, too:
Nearly 2 in 5 millennials (38%) would back a candidate on a cost-of-living plan alone, and 36% of Gen Z say the same.
In Gen X and baby boomers, support dropped to 32% and 30%, respectively.
Who Voters Hold Responsible for Prices
More than half of voters (52%) hold the White House most responsible for the prices they pay. That share varies widely by party, age, and region:
By party, Democrats (69%) are the most likely to point to the White House, followed by independents (49%) and Republicans (22%).
By generation, baby boomers lead in blaming the White House, at 66%, followed by Gen X (56%), millennials (50%), and Gen Z (40%).
By region, Northeast voters are the most likely to blame the White House (61%), ahead of the West (54%). The Midwest and South tie at 48%.
Methodology
We surveyed 1,005 registered U.S. voters about how their household finances have changed since 2024, which costs have squeezed them most, what they've cut to make ends meet, whether they trust official inflation numbers, and how money is shaping their November 3rd midterm vote, from crossing party lines to the monthly savings it would take to earn their support. The generational breakdown was 47% millennials, 27% Gen X, 16% Gen Z, and 10% baby boomers. The political affiliation breakdown was 46% Democrat, 27% independent, and 23% Republican. Data was collected in September 2026. The survey was conducted via CloudResearch Connect.
About Oobit
Oobit is a crypto payments app that lets you pay with crypto anywhere Visa is accepted, in stores and online. The Oobit crypto card connects to the self-custody wallet you already use and works at over 175 million Visa merchants, including supermarkets. You can add the card to Apple Pay or Google Wallet for tap-to-pay checkout and earn crypto cashback on your purchases.
Fair Use Statement
You're welcome to share these findings for noncommercial purposes. If you do, please credit Oobit and link to the original source.







_2026-10-12_11-56-54.avif)





%202.svg)